MFJ-224 Instruction Manual 2-Meter FM Analyzer
1
Introduction
Congratulations on purchasing the MFJ-224 2-Meter FM Analyzer. With this versatile
handheld instrument, you can tune in any signal between 143.5 and 148.5 MHz to
monitor field strength in dBm and FM-deviation in kHz. Accurate tuning is made simple,
thanks to the built-in discriminator-meter
function. Battery status
is also displayed. In
addition to metered functions, the MFJ-224 lets you visually analyze modulation
waveforms and measure instantaneous-peak deviation by plugging into an oscilloscope.
Finally, a headphone monitor circuit helps you tune in and identify signals easily. Before
exploring the MFJ-224's many uses, please take a few minutes to read this manual. A
special orientation section is provided to help you get started.
Technical Specifications
Frequency Coverage.................... 143.5 - 148.5 MHz
Selectivity.................................... -6 dB @ 20 kHz
Receiver Type.............................. Dual Conversion, 10.7 MHz 1st IF, 455 kHz 2nd IF
Oscilloscope Output .................... 1 V p-p for 1-kHz tone at 5-kHz deviation
Phone Jack Output....................... Lo-Z, preset volume level
RSSI Range ................................. -100 dBm to -40 dBm (60-dB range)
Deviation Range......................... 0-7 kHz on Meter, 0-20 kHz on scope (1-kHz tone).
Discriminator Meter Range......... +/- 3 kHz, Zero-centered
Operating Voltage ....................... 6.5 - 9.0 Volts DC
Power Source............................... 9-Volt rectangular alkaline battery
+
-
Frequency
Meter
Power
Monitor
MFJ-224
1
2
3
5
6
7
8
9
1. Power Off/On Switch
2. Power "On" LED
3. Oscilloscope Output (RCA)
4. Headphone Jack (3.5mm)
5. Headphone Monitor "on" switch
6. Meter Function Switch
7. Tuning Knob--Frequency
8. Meter, 3" Precision Movement
9. Antenna Connector (SO-238)
Controls and Jacks
.
Signal
Discriminator
Deviation
Battery
4

MFJ-224 Instruction Manual 2-Meter FM Analyzer
2
What Your Meter Can Do
The MFJ-224 performs countless jobs around the shop or radio shack. Here are some
uses we think you'll appreciate:
•
••
• Evaluate Antenna Performance: Measure key yagi specifications such as
gain over a
dipole
(dBd),
beamwidth
(-3dB points),
front-to-back ratio
, and
sidelobe suppression
.
You can compare antennas to see which works best, and check the real-world
performance of experimental antennas against NEC-based computer predictions.
•
••
• Detect Feedline Faults: Document end-to-end cable loss in dB. Find out if kinks,
corrosion, and moisture have deteriorated performance--or discover if a new feedline
meets factory specs. See how much signal is actually lost between the antenna and
radio.
•
••
• Map Repeater Field-strength: Plot repeater or packet-node field strength in dBm or
microvolts throughout the coverage area. Find out where the signal is going--and where
it isn't. Evaluate the impact of site changes with accuracy.
•
••
• Site your Antennas: Take the MFJ-224 to the mountain, on the roof, or up the tower
to position antennas for best performance (a few feet either way can make a big
difference over difficult paths). Aim yagis with absolute pin-point accuracy.
•
••
• Measure Preamp Gain: Tune preamps for best gain and noise figure using your
meter, a scope, and a weak signal source. Measures
exact
gain
in dB.
•
••
• Fox Hunt: Track down hidden transmitters--or nail jammers fast! High resolution 60-
dB RSSI display is amateur radio's most accurate S-meter.
•
••
• Check and Set Deviation: Measure transmitter deviation anywhere in the band. Use
the built-in meter display with a test-tone, or plug into a scope for accurate
instantaneous-peak readings on speech, packet, DTMF, and CTCSS tones. Help your
fellow hams--the MFJ-224 can measure the deviation of any signal you can hear off-air!
•
••
• Analyze Audio Quality: Use the oscilloscope output to visually evaluate the quality of
speech or tones by viewing the audio waveform. See if tones are clipped or distorted, if
the speech limiter is working improperly, etc. Solve FM audio problems fast!
•
••
• Scan the Band: Tune in and identify signals using monaural or stereo Lo-Z
headphones. Check speech quality of your radios or use as a second receiver to monitor
activity.
•
••
• Tune Transmitters and Filters: Use with RF-sniffer probe to tune low-power
transmitter stages. Tune high-Q filters and networks for best response, lowest loss.

MFJ-224 Instruction Manual 2-Meter FM Analyzer
3
How Your Meter Works
A Motorola FM-receiver IC with logarithmic RSSI metering circuitry measures signal
strength over a 60-dB dynamic range. This allows input levels from -100 dBm to -40
dBm to be displayed on a linear meter scale with 1-dB resolution. In addition to
providing accurate RSSI, the IC features a built-in tunable oscillator--plus outputs to
drive the FM-deviation detector, headphone monitor circuit, and a discriminator tuning
meter. The block diagram below illustrates how the MFJ-224 is organized:
RSSI
Disc
Audio
ScopePhones
Monitor
Dev
Detect
Op Amp
Receiver IC
V
Reg
Bat Status
Pwr
9V
Tune
Ant
Meter
Display
Sw
+
Osc
Vcc
1st LO
1st Mxr
Detailed operating instructions will help you understand how each feature works--and
how to get the most from your meter..
Battery Installation
Before using your meter for the first time, you must install a fresh 9-volt battery. The
MFJ-224 draws about 20 mA when in use, and can operate for many hours between
battery changes. However, we suggest you check
battery status
each time you turn the
unit on. The MFJ-224 is voltage regulated, and battery voltage may drop as low as 7-
volts before operation becomes erratic. When purchasing a battery, be sure to select a
premium-quality alkaline type--such as Duracell MN1604, Eveready 522, Ray-O-Vac A-
1604, or Radio Shack 23-553.
Begin installation by removing the mounting screws from both side panels of the meter
case. Gently separate the front and back sections, taking care not to pull on the antenna
lead or battery wires. If replacing a spent alkaline battery, dispose of it in a prescribed
manner. To install the new battery, snap on the 9-volt connector and press the case
firmly
into the retainer clip (make sure it can't pop loose). Now, re-assemble the case.
IMPORTANT NOTE: To protect your unit from damage due to battery leakage,
remove the battery when storing for prolonged periods.

MFJ-224 Instruction Manual 2-Meter FM Analyzer
4
Orientation--Hooking Up Your Meter
To become familiar with the various features and functions of your MFJ-224, connect it
up as shown below (if you lack an oscilloscope, omit that portion of the orientation).
1. Headphones: You'll need a pair of low-impedance headphones outfitted with a 3.5
mm (1/8") plug. Without phones, you will be unable to identify signals and tune them in
properly. The headphone circuit is configured to work with either stereo or monaural
plugs and wiring, but a pair of good-quality stereo phones work best. Headphone audio
level is pre-set to a low-but-comfortable listening level.
2. Antenna: The MFJ-224 accepts any 50Ω source outfitted with a UHF connector.
Avoid directly-connecting RF levels exceeding -20 dBm (.03 volts) to the meter. To
sample stronger sources, use a pick-up probe or resistive attenuator. For the purpose of
this orientation, connect a 2-Meter station antenna to monitor off-air signals.
IMPORTANT NOTE: Your MFJ-224 is a sensitive instrument. To avoid damage,
never connect a transmitter or powerful RF oscillator directly to the antenna jack.
3. Oscilloscope: Connecting a scope to the MFJ-224 enhances its value as a deviation
meter and audio analyzer. Since only audio frequencies are monitored, any general-
purpose scope will have sufficient frequency response. However, a well-calibrated unit
will yield more accurate deviation readings. Connect your meter to the scope's vertical-
amplifier input using shielded cable. To begin, set the sweep for .5 mS and vertical gain
for 0.2 volts per division. A 1-kHz test-tone modulating a FM transmitter to 5-kHz of
deviation normally produces a sine-wave output of about 1.0 volts p-p.
0.2V
Vert
Scope Phones
Antenna
2-Meter Antenna
Oscilloscope
Headphones
MFJ-224
You are now ready to explore the basic features and functions of the MFJ-224.

MFJ-224 Instruction Manual 2-Meter FM Analyzer
5
Orientation--Learning To Use Your Meter
1. Power On: To power-up your unit, depress the
power
switch
.
The green pilot LED
should illuminate.
2. Battery Status: To check battery condition, turn the meter selector switch to
battery
and note the indication. The meter should swing into the
good
zone of the scale.
3. Headphone Monitor Switch: To monitor signals, plug in headphones and depress
the
monitor
switch. You should hear a strong background hiss. This is FM-receiver
noise.
4. Tuning: The
Frequency
(variable frequency oscillator) control tunes the meter's FM
receiver. Use the vernier-reduction tuning knob to scan across the band for active
repeaters in your area. These will provide sample signals for you to analyze.
-100
-90
-80
-70
-60
-50
-40
2
3
45
6
7
Dev - kHz
+
-
Discr
Bat
Field-strength scale
displays level of
incoming signal.
Deviation scale displays
FM-carrier swing during
modulation of signal.
RSSI - dBm
RSSI
-
dB
m
Dev - kHz
Battery
Displays battery voltage,
indicates if battery is okay.
Discriminator
Tuning aid--meter centers when
signal is tuned in correctly.
MFJ
-
224
M
eter
F
ace
5. Discriminator Meter Function: Turn the meter selector to
discriminator
. This
function is a tuning aid to help you zero-in signals before making measurements.
Accurate tuning is important because readings taken while the receiver is mistune-tuned
may be incorrect. The discriminator meter normally hovers around center-scale with no
station present--then deflects sharply as you tune across a signal. Practice tuning stations
for a
center-scale meter reading
. The indicator is
very
sensitive, and tuning "dead on"
may take some practice!
6. Signal Meter Function: The
Signal
, or
RSSI
(
Recovered Signal Strength Indicator)
function, displays incoming signal strength. The meter scale is calibrated in dBm, a unit
of RF power (0 dBm = 1 mW @ 50-Ω). The dBm unit is especially convenient because it
may be used for making signal-level comparisons directly in dB. Note that it is normal

MFJ-224 Instruction Manual 2-Meter FM Analyzer
6
for the meter to read below -100 dBm with no signal present. Check the repeater signals
in your area and note the level differences between them in dB!

MFJ-224 Instruction Manual 2-Meter FM Analyzer
7
7. Deviation Function: Use the
deviation
function
to check transmitter modulation.
The 0-7 kHz scale on the meter is accurate
only
when a continuous audio or packet
calibration tone is applied to the transmitter under test. However, you can get a pretty
good idea who's over-deviating and who's not by watching meter movement on normal
speech. For a better look at deviation, turn on your oscilloscope. This provides an
accurate display for
any
type of modulation--from normal speech or AFSK, to CTCSS
and DTMF tones. Use the chart on page 10 to convert from
peak-to-peak voltage
to
deviation in kHz.
Now that you've mastered the basics of meter operation, the next section will cover some
specific tips and useful data to help you get the most from your meter.
Field-Strength Measurements
1. dBm, dB, and uV: The
Signal
(or RSSI) meter scale is calibrated in dBm, a unit of
RF power. As previously mentioned, calibrating the scale in dBm is convenient because
it allows comparison of signal
differences
directly in dB. Signal strength is also
commonly expressed in uV (or micovolts). This is a unit of RF voltage. The following
chart may be used to convert dBm readings into uV:
Power in dBm Microvolts
-100 dBm 3 uV
-90 dBm 10 uV
-80 dBm 30 uV
-70 dBm 100 uV
-60 dBm 300 uV
-50 dBm 1000 uV
-40 dBm 3000 uV
2. Field-strength Measurements: When mapping field strength, you'll find it helpful to
use a portable yagi rather than a dipole or omnidirectional antenna. The yagi reduces
measurement errors due to
multi-path interference
(signals reflected from hills, buildings,
etc.). To compensate dBm meter readings for yagi gain, use the following formula:
RSSI Reading in dBm - Antenna Gain in dBd* = Field Strength
*dBd means gain compared to a 1/2-wave dipole. If yagi gain is given in dBi (dB
compared to an isotropic source), be sure to subtract 2.14 dB from this figure to
get dBd. For example, a yagi with 8.14 dBi gain will exhibit 6.00 dBd gain over
a dipole.

MFJ-224 Instruction Manual 2-Meter FM Analyzer
8
3. Comparing Antenna Performance: The
Signal
display is useful for comparing two
or more antennas for best performance. In most cases, a local repeater may be used as a
signal source. These results can be extremely accurate, but only if steps are taken to
prevent error. Here is a list of tips for getting good results:
[ ] Position each antenna at the same exact location and height (one at a time).
[ ] Mount antennas at least 15 feet above ground--away from other objects or feedlines.
[ ] Find a spot where the signal is stable, avoiding nulls or multipath-prone locations.
[ ] Watch for minor signal-level drifting (1-2 dB) due to propagation enhancements.
[ ] Use identical coax feeds and the same type of mast for each antenna under test.
[ ] Fully decouple each antenna from its feedline to prevent stray pickup.
[ ] Change antennas quickly, and keep other test antennas out of the way.
[ ] Repeat tests to confirm that your data will hold up under repetitive trials.
If you use a locally-generated signal source, place it--at minimum--several wavelengths
down-range (out of the antenna's near field). Also, use the same antenna height and
polarization as the antenna under test.
4. Yagi Performance: The
Signal
function can tell you a great deal about the
performance of directional antennas such as quads and yagis. To test these, you'll need a
compass rose at the base of your mast--or a rotator with a control box--so you can
document degrees of rotation off-axis from the signal source. The primary specifications
for directional antennas are:
Forward Gain (dBd): How much advantage does your directional antenna provide
over a 1/2-wave dipole? To find out, use the comparison techniques outlined above.
The directional antenna should be pointed at the source, and the dipole aligned
broadside. Your reference dipole should be properly matched and fully decoupled
from its feedline by a balun or by ferrite beads. Note that gain figures will change
with frequency.
Beamwidth: How broad is your antenna pattern? To find out, aim it at the signal
source and rotate until the RSSI meter drops by 3 dB (the antenna's
half-power point
).
Now, rotate the opposite way--through the peak--until it again drops by 3 dB. The
degrees of rotation between -3 dB points is called the
beamwidth
. Generally, wide-
beamwidth antennas have less gain and narrow-beamwidth antennas have more gain.
Front-to-Back Ratio: How well does your antenna reject signals off its back side?
To measure
front-to-back ratio
, first point your antenna at the signal source and
record the RSSI reading. Then, swing the antenna 180-degrees and record the back
reading. The difference in dBm is the front-to-back ratio in dB. These days, the term
"Front-To-Rear" ratio is also commonly used. This represents an
average
of several
back-readings taken over a span of 30 degrees. Many designers feel that Front-To-
Rear Ratio provides a more accurate picture of the antenna's true performance.

MFJ-224 Instruction Manual 2-Meter FM Analyzer
9
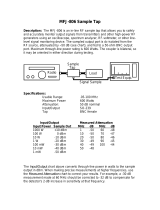
Sidelobe Suppression: Sidelobes are "peaks" in antenna response that occur off the
side of a directional antenna. A well-designed yagi will have a clean well-defined
pattern with only a few weak sidelobes. However, a poorly-designed yagi may have
several strong peaks off to the side. If your yagi has a sidelobe problem, you can spot
it easily on the RSSI display as you rotate the antenna. However--beware of
multipath reflections--they can
look
like sidelobes in hilly or built-up locations!
Characteristics of a Typical Yagi Directional Antenna
Beamwidth
Front Back
Sidelobe area
Sidelobe area
-3 dB
-3dB
-20 dB
Gain = 9dBd
Front-to-Back
Ratio
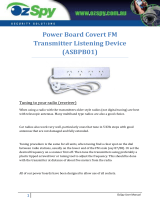
5. Coaxial Line Loss: The
Signal
(RSSI) function, when used in conjunction with a
signal generator, can provides accurate end-to-end loss measurements for 50Ω coaxial
line. With this test, you can determine how much signal is being attenuated between the
antenna and radio--or check feedlines for signs of deterioration. To do this, first measure
the output level of your signal generator through a short patch cable. Then, replace the
patch cable with the length of feedline you wish to test--and measure again. The
difference between the two RSSI readings will be the
measured loss
in dB for your cable.
Cable Under
Test
Signal Source
MFJ-XXX
Level = -60 dBm
Level = -65 dBm
Loss = 5 dB
Measured Loss = Signal at Generator - Signal at Cable Far End
Example: If a signal generator is set for -60 dBm output and delivers -65 dBm to the far
end of a cable, the
measured loss
is 5 dB.

MFJ-224 Instruction Manual 2-Meter FM Analyzer
10
Measuring Deviation
Deviation
is the amount of carrier-shift used by FM transmitters to convey speech or data.
For more information about how frequency modulation works, consult a current edition
of
The ARRL Handbook for Radio Amateurs
. The FM reference will provide a useful
theoretical background for this popular mode.
Controlling deviation is important. Too much of it will cause interference on adjacent
channels, and too little will result in poor speech intelligibility or failure to connect. As a
rule of thumb, deviation on the 2-Meter amateur band should
never
exceed 5 kHz.
Generally, the following modulation levels are prescribed for 2-Meter amateur service:
Mode Deviation Level
Speech 3 kHz average, 5 kHz peak
Packet 3 kHz continuous
CTCSS 0.6 kHz superimposed tone
1. Preparing for Deviation Adjustments: Deviation adjustments are normally made
with a continuous 1-kHz sinewave applied to the microphone jack using an AF signal
generator. For packet, these adjustments are made using the TNC's built-in
calibrate
function. When adjusting FM transceivers, study all relevant service documents carefully
and follow the manufacturer's instructions closely.
The MFJ-224 is a sensitive instrument and you must take care not to overload it during
transmitter deviation tests. To limit ambient RF levels in the test area, terminate the
transmitter under test with a shielded 50Ω dummy load. Also, use the
minimum
amount
of antenna pick-up required to obtain a good signal sample on your meter (
never
connect
a transmitter directly to the meter). Levels around -60 to -70 dBm RSSI will provide a
clean noise-free signal for evaluation. Tune the transmitter signal in carefully, observing
the discriminator meter for centering. Also, check the discriminator meter periodically
during tests and correct any receiver drift.
2. Deviation Readout on the Meter: The meter displays deviation for any
continuously-modulated FM signal between 2 and 7 kHz. As mentioned earlier, a 1-kHz
tone or packet calibration tone should be applied to the transmitter under test. The meter
cannot be used to set CTCSS tones because it cannot register deviation accurately below
2 kHz (you must use a scope).
IMPORTANT NOTE: It is normal for the deviation meter to deflect full scale when no
signal is being received. This is due to FM limiter noise. Also, the deviation level on
weak signals way read somewhat higher due to noise contribution. Make sure signals
are "full quieting" when measuring deviation.

MFJ-224 Instruction Manual 2-Meter FM Analyzer
11
3. Deviation Readout with an Oscilloscope: Checking deviation with a scope provides
an
instantaneous peak
display of modulation level. This means you can look at speech
waveforms and estimate deviation with reasonable accuracy--something not possible
using the meter scale. Also, low-level signals such a PL-tones (CTCSS) are set easily
using the scope display. Finally, audio problems such as overload distortion, non-
linearity, or limiter mis-adjustment are easier to spot and diagnose on a CRT display. To
measure deviation with your scope, use the voltage chart provided below. A sweep rate
of .5 mS and a vertical amplifier sensitivity of .2V (200 mV) per division is
recommended for adjustments up to 5 kHz.
IMPORTANT NOTE
: When measuring deviation on a scope, set the MFJ-224 Meter
Switch to either the Battery or Signal position. This will prevent the metering circuits
from loading down the signal being fed to your scope. Scope readings taken with the
meter switch in the Discriminator or Deviation position may be somewhat reduced in
amplitude--and will not conform to the calibration chart shown below:
Voltage p-p kHz Deviation
0.12 0.6 (CTSS levels)
0.2 1
0.4 2
0.6 3 (Packet Calibration Tone)
0.8 4
1.0 5 (1-kHz tone or Peak Speech)
1.2 6
1.4 7
1.6 8
1.8 9
2.0 10
It should be noted that this chart provides p-p voltage levels generated by a
typical
MFJ-
224 scope-monitor circuit, and minor variations may occur from unit to unit. If you
monitor deviation often, it may prove helpful to make up a clear-plastic overlay for your
CRT screen calibrated for direct readings in kHz.
4. Off-air Monitoring: As a general rule, you will be more successful monitoring off-
air deviation using an oscilloscope. Most signals you encounter will consist of speech
and short packet bursts, neither of which display accurately on the meter because of its
relatively slow response time. Be prepared for an eye-opening experience! Most hams
have never measured the FM deviation of their transmitters, and levels often vary widely
from station to station!

MFJ-224 Instruction Manual 2-Meter FM Analyzer
12
Limitations
The MFJ-224 is a highly-affordable handheld tester that will help you perform many
functions that would otherwise require a sophisticated FM service monitor. However,
please keep in mind that it is not a direct replacement for a $5000 commercial instrument!
Here are some of the unit's natural limitations--and some useful tips to help you work
around them:
1. The VFO is LC-tuned (not synthesized). Because of this the receiver may be subject to
minor frequency drift when exposed to temperature changes or when first turned on.
Use the discriminator meter function to ensure accurate tuning before taking readings.
2. The receiver 1st-IF filter at 10.7 MHz is fairly broad. When tuning
extremely strong
signals
, the band of "quieting" on either side of center-signal may be wide--making
tuning by ear alone somewhat difficult. In this case, use the discriminator meter to
locate the exact center of the signal.
3. The MFJ-224 receiver is, by design, approximately 20 dB less sensitive than a typical
VHF-FM transceiver (this is done to accommodate bench measurements involving
strong transmitter signals). If you must copy extremely weak off-air signals for
diagnostic purposes, you may install an external in-line 2-Meter preamplifier to boost
sensitivity. Be sure to incorporate preamp gain into your measurements. For example,
if your preamp has a measured gain of 20 dB, be sure to subtract this gain from your
meter reading. For example, a -90 dBm reading made with a 20dB preamp in-line
would indicate an actual input signal strength of -110 dBm (-90dB [-]+20 dBm = -
110 dBm).
These limitations should not significantly detract from the unit's many overall
capabilities.
Technical Assistance
If you have any problem with this unit first check the appropriate section of this manual.
If the manual does not reference your problem or your problem is not solved by reading
the manual, you may call
MFJ Technical Service
at 601-323-0549 or the
MFJ Factory
at
601-323-5869. You will be best helped if you have your unit, manual and all information
on your station handy so you can answer any questions the technicians may ask.
You can also send questions by mail to MFJ Enterprises, Inc., 300 Industrial Park Road,
Starkville, MS 39759; by FAX to 601-323-6551; or by email to [email protected].
Send a complete description of your problem, an explanation of exactly how you are
using your unit, and a complete description of your station.

MFJ-224 Instruction Manual 2-Meter FM Analyzer
13
Field Service Guide
The MFJ-224 has several serviceable calibration adjustments. If you lack the necessary
equipment or expertise to service sensitive VHF communications equipment,
please do
not attempt these adjustments!
Instead, contact a qualified 2-way service technician in
your area for assistance or return your unit to the factory for service. To service the unit,
remove the screws from the side of the case and separate the front and back sections. The
top-side of the circuit board will be exposed for easy access.
1. RF Input: Apply a 146-MHz test signal and adjust L1 for maximum
Signal
reading.
2. Frequency Calibration: Set the
Tuning
dial to 146 MHz and apply a 146-MHz test
signal. Adjust L2 so that the test signal is heard at the 146-MHz dial setting.
3. Quad-coil Tuning: Tune to a spot on the dial where no signal is present. Connect a
DVM to TP-1 (test point). Tune quad-coil L3 for a reading of 2.45 volts dc.
4. Discriminator Meter Zero: Switch the meter selector to
discriminator
and adjust
the
Discriminator Center
trimpot for a center-scale indication with no signal.
5. RSSI Calibrate: Set the meter switch to
Signal (RSSI).
Using a precision signal
generator with calibrated output (HP-8640B or equivalent), apply a -90 dBm signal at
146 MHz. Tune in this signal and adjust the
RSSI Cal
trimpot for a reading of -90
dBm on the meter. Now, increase the generator level to -50 dBm and adjust the
RSSI
Range
trimpot for a -50 dBm reading. Repeat this procedure back and forth--until the
meter reads accurately at both signal levels. Note that it is normal for the
Signal
meter to read well below -100 dBm when no signal is present.
Calibration Adjustment Locations-MFJ-224
L2
L1
L3
Deviation
RSSI
Scope
Phones
VFO Tune
Meter
Sw
U1
VFO Cal
RF
Mon Sw
TP-1
Quad
Coil
2.45V
Cal
Center
RSSI
Range
Power Sw

MFJ-224 Instruction Manual 2-Meter FM Analyzer
14
Schematic
/