Page is loading ...

APOGEE INSTRUMENTS, INC. | 721 WEST 1800 NORTH, LOGAN, UTAH 84321, USA
TEL: (435) 792-4700 | FAX: (435) 787-8268 | WEB: APOGEEINSTRUMENTS.COM
Copyright © 2022 Apogee Instruments, Inc.
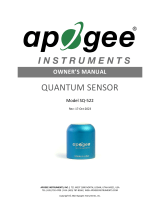
OWNER’S MANUAL
QUANTUM SENSOR
Models SQ-512 and SQ-515
Rev: 25-Oct-2022

TABLE OF CONTENTS
Owner’s Manual ............................................................................................................................................................................... 1
Certificates of Compliance ....................................................................................................................................................... 3
Introduction ............................................................................................................................................................................. 5
Sensor Models ......................................................................................................................................................................... 6
Specifications ........................................................................................................................................................................... 7
Deployment and Installation .................................................................................................................................................. 10
Cable Connectors ................................................................................................................................................................... 11
Operation and Measurement ................................................................................................................................................ 11
Maintenance and Recalibration ............................................................................................................................................. 18
Troubleshooting and Customer Support ................................................................................................................................ 20
Return and Warranty Policy ................................................................................................................................................... 22

CERTIFICATE OF COMPLIANCE
EU Declaration of Conformity
This declaration of conformity is issued under the sole responsibility of the manufacturer:
Apogee Instruments, Inc.
721 W 1800 N
Logan, Utah 84321
USA
for the following product(s):
Models: SQ-512, SQ-515
Type: Quantum Sensor
The object of the declaration described above is in conformity with the relevant Union harmonization legislation:
2014/30/EU Electromagnetic Compatibility (EMC) Directive
2011/65/EU Restriction of Hazardous Substances (RoHS 2) Directive
2015/863/EU Amending Annex II to Directive 2011/65/EU (RoHS 3)
Standards referenced during compliance assessment:
EN 61326-1:2013 Electrical equipment for measurement, control, and laboratory use – EMC requirements
EN 63000:2018 Technical documentation for the assessment of electrical and electronic products with
respect to the restriction of hazardous substances
Please be advised that based on the information available to us from our raw material suppliers, the products
manufactured by us do not contain, as intentional additives, any of the restricted materials including lead (see
note below), mercury, cadmium, hexavalent chromium, polybrominated biphenyls (PBB), polybrominated
diphenyls (PBDE), bis (2-ethylhexyl) phthalate (DEHP), butyl benzyl phthalate (BBP), dibutyl phthalate (DBP), and
diisobutyl phthalate (DIBP). However, please note that articles containing greater than 0.1 % lead concentration
are RoHS 3 compliant using exemption 6c.
Further note that Apogee Instruments does not specifically run any analysis on our raw materials or end products
for the presence of these substances, but we rely on the information provided to us by our material suppliers.
Signed for and on behalf of:
Apogee Instruments, October 2022
Bruce Bugbee
President
Apogee Instruments, Inc.

CERTIFICATE OF COMPLIANCE
UK Declaration of Conformity
This declaration of conformity is issued under the sole responsibility of the manufacturer:
Apogee Instruments, Inc.
721 W 1800 N
Logan, Utah 84321
USA
for the following product(s):
Models: SQ-512, SQ-515
Type: Quantum Sensor
The object of the declaration described above is in conformity with the relevant UK Statutory Instruments and
their amendments:
2016 No. 1091 The Electromagnetic Compatibility Regulations 2016
2012 No. 3032 The Restriction of the Use of Certain Hazardous Substances in Electrical and Electronic
Equipment Regulations 2012
Standards referenced during compliance assessment:
BS EN 61326-1:2013 Electrical equipment for measurement, control, and laboratory use – EMC requirements
BS EN 63000:2018 Technical documentation for the assessment of electrical and electronic products with
respect to the restriction of hazardous substances
Please be advised that based on the information available to us from our raw material suppliers, the products
manufactured by us do not contain, as intentional additives, any of the restricted materials including lead (see
note below), mercury, cadmium, hexavalent chromium, polybrominated biphenyls (PBB), polybrominated
diphenyls (PBDE), bis (2-ethylhexyl) phthalate (DEHP), butyl benzyl phthalate (BBP), dibutyl phthalate (DBP), and
diisobutyl phthalate (DIBP). However, please note that articles containing greater than 0.1 % lead concentration
are RoHS 3 compliant using exemption 6c.
Further note that Apogee Instruments does not specifically run any analysis on our raw materials or end products
for the presence of these substances, but we rely on the information provided to us by our material suppliers.
Signed for and on behalf of:
Apogee Instruments, October 2022
Bruce Bugbee
President
Apogee Instruments, Inc.

INTRODUCTION
Radiation that drives photosynthesis is called photosynthetically active radiation (PAR) and is typically defined as
total radiation across a range of 400 to 700 nm. PAR is almost universally quantified as photosynthetic photon flux
density (PPFD), the sum of photons from 400 to 700 nm in units of micromoles per square meter per second (µmol
m-2 s-1, equal to microEinsteins m-2 s-1). While microEinsteins and micromoles are equal (one Einstein = one mole of
photons), the Einstein is not an SI unit, so expressing PPFD as µmol m-2 s-1 is preferred. Daily total PPFD is typically
reported in units of moles of photons per square meter per day (mol m-2 d-1) and is often called daily light integral
(DLI).
The acronym PPF is also used and refers to the photosynthetic photon flux. The acronyms PPF and PPFD refer to
the same variable. Both terms are used because there is not a universal definition of the term flux. Flux is
sometimes defined as per unit area per unit time and sometimes defined as per unit time only. PPFD is used in this
manual.
Sensors that measure PPFD are often called quantum sensors due to the quantized nature of radiation. A quantum
refers to the minimum quantity of radiation, one photon, involved in physical interactions (e.g., absorption by
photosynthetic pigments). In other words, one photon is a single quantum of radiation.
Typical applications of quantum sensors include measurement of incident PPFD on plant canopies in outdoor
environments or in greenhouses and growth chambers and reflected or under-canopy (transmitted) PPFD
measurement in the same environments.
Apogee Instruments SQ series quantum sensors consist of a cast acrylic diffuser (filter), photodiode, and signal
processing circuitry mounted in an anodized aluminum housing, and a cable to connect the sensor to a
measurement device. SQ-500 series quantum sensors are designed for continuous PPFD measurement in indoor or
outdoor environments.

SENSOR MODELS
This manual covers the amplified voltage output quantum sensors, models SQ-512 and SQ-515 (listed in bold
below). Additional models are covered in their respective manuals.
Model
Signal
SQ-512
0-2.5 V
SQ-515
0-5 V
SQ-500
0-40 mV
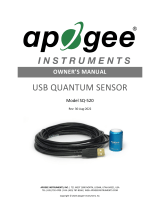
SQ-520
USB
SQ-521
SDI-12
SQ-522
Modbus
Serial Numbers 3636 (SQ-512), 3717 (SQ-515)
and above: A sensor’s model number and serial
number are located on the bottom of the sensor.
If you need the manufacturing date of your
sensor, please contact Apogee Instruments with
the serial number of your sensor.
Serial Number 0-3635 (SQ-512), 0-3716
(SQ-515): A sensor’s model number and
serial number are located near the pigtail
leads on the sensor cable. If you need the
manufacturing date of your sensor, please
contact Apogee Instruments with the serial
number of your sensor.

SPECIFICATIONS
SQ-512
SQ-515
Power Supply
5 to 24 V DC
5.5 to 24 V DC
Current Draw
12 V is 57 µA
Sensitivity
0.625 mV per µmol m-2 s-1
1.25 mV per µmol m-2 s-1
Calibration Factor
(Reciprocal of Sensitivity)
1.6 µmol m-2 s-1 per mV
0.8 µmol m-2 s-1 per mV
Calibration Uncertainty
± 5 % (see calibration Traceability below)
Measurement Range
0 to 4000 µmol m-2 s-1
Measurement Repeatability
Less than 1 % (up to 4000 µmol m-2 s-1)
Calibrated Output Range
0 to 2.5 V
0 to 5 V
Long-term Drift
(Non-stability)
Less than 2 % per year
Non-linearity
Less than 1 % (up to 4000 µmol m-2 s-1)
Response Time
Less than 1 ms
Field of View
180°
Spectral Range
389 to 692 nm ± 5 nm (wavelengths where response is greater than 50 %)
Calibrated Spectral Range
400 to 700 nm
Spectral Selectivity
Less than 10 % from 412 to 682 ± 5 nm (see Spectral Response below)
Directional (Cosine)
Response
± 2 % at 45º zenith angle, ± 5 % at 75º zenith angle (see Directional Response below)
Azimuth Error
Less than 0.5 %
Tilt Error
Less than 0.5 %
Temperature Response
-0.11 ± 0.04 % per C (see Temperature Response below)
Uncertainty in Daily Total
Less than 5 %
Detector
Blue-enhanced silicon photodiode
Housing
Anodized aluminum body with acrylic diffuser
IP Rating
IP68
Operating Environment
-40 to 70 C; 0 to 100 % relative humidity; can be submerged in water up to depths of 30 m
Dimensions
Serial # 3636 (SQ-512),
3717 (SQ-515) and above
30.5 mm diameter, 37 mm height
Dimensions
Serial # 0-3635 (SQ-512),
0-3716 (SQ-515)
24 mm diameter, 37 mm height
Mass (with 5 m of cable)
Serial # 3636 (SQ-512),
3717 (SQ-515) and above
140 g
Mass (with 5 m of cable)
Serial # 0-3635 (SQ-512),
0-3716 (SQ-515)
100 g
Cable
5 m of shielded, twisted-pair wire; TPR jacket (high water resistance, high UV stability,
flexibility in cold conditions); pigtail lead wires; stainless steel (316), M8 connector

Calibration Traceability
Apogee Instruments SQ-500 series quantum sensors are calibrated through side-by-side comparison to the mean
of four transfer standard quantum sensors under a reference lamp. The reference quantum sensors are
recalibrated with a quartz halogen lamp traceable to the National Institute of Standards and Technology (NIST).
Spectral Response
Temperature Response
Mean spectral response measurements
of six replicate Apogee SQ-100 (original)
and SQ-500 (full-spectrum) series
quantum sensors. Spectral response
measurements were made at 10 nm
increments across a wavelength range of
300 to 800 nm with a monochromator
and an attached electric light source.
Measured spectral data from each
quantum sensor were normalized by the
measured spectral response of the
monochromator/electric light
combination, which was measured with
a spectroradiometer.
Mean temperature response of ten SQ-
500 series quantum sensors (errors bars
represent two standard deviations above
and below mean). Temperature response
measurements were made at 10 C
intervals across a temperature range of
approximately -10 to 40 C in a
temperature-controlled chamber under a
fixed, broad spectrum, electric lamp. At
each temperature set point, a
spectroradiometer was used to measure
light intensity from the lamp and all
quantum sensors were compared to the
spectroradiometer. The
spectroradiometer was mounted external
to the temperature control chamber and
remained at room temperature during
the experiment.

Cosine Response
Mean directional (cosine)
response of seven apogee SQ-500
series quantum sensors.
Directional response
measurements were made on the
rooftop of the Apogee building in
Logan, Utah. Directional response
was calculated as the relative
difference of SQ-500 quantum
sensors from the mean of replicate
reference quantum sensors (LI-
COR models LI-190 and LI-190R,
Kipp & Zonen model PQS 1). Data
were also collected in the
laboratory using a reference lamp
and positioning the sensor at
varying angles.
Directional (cosine) response is defined as the
measurement error at a specific angle of radiation
incidence. Error for Apogee SQ-500 series quantum
sensors is approximately ± 2 % and ± 5 % at solar
zenith angles of 45° and 75°, respectively.

Important: Only use the nylon screw provided
when mounting to insulate the non-anodized
threads of the aluminum sensor head from the
base to help prevent galvanic corrosion. For
extended submersion applications, more insulation
may be necessary. Contact Apogee tech support for
details.
DEPLOYMENT AND INSTALLATION
Mount the sensor to a solid surface with the nylon mounting screw provided. To accurately measure PPFD incident
on a horizontal surface, the sensor must be level. An Apogee Instruments model AL-100 leveling plate is
recommended for this purpose. To facilitate mounting on a cross arm, an Apogee Instruments model AL-120
mounting bracket is recommended.
To minimize azimuth error, the sensor should be mounted with the cable pointing toward true north in the
northern hemisphere or true south in the southern hemisphere. Azimuth error is typically less than 0.5 %, but it is
easy to minimize by proper cable orientation.
In addition to orienting the cable to point toward the nearest pole, the sensor should also be mounted such that
obstructions (e.g., weather station tripod/tower or other instrumentation) do not shade the sensor. Once
mounted, the blue cap should be removed from the sensor. The blue cap can be used as a protective covering for
the sensor when it is not in use.
Nylon Screw: 10-32 x 3/8
Model: AL-100
Model: AL-120
Nylon Screw: 10-32 x 3/8

CABLE CONNECTORS
Apogee started offering cable connectors on some
bare-lead sensors in March 2018 to simplify the
process of removing sensors from weather stations for
calibration (the entire cable does not have to be
removed from the station and shipped with the
sensor).
The ruggedized M8 connectors are rated IP68, made
of corrosion-resistant marine-grade stainless-steel,
and designed for extended use in harsh environmental
conditions.
Cable connectors are attached directly to the head.
Instructions
Pins and Wiring Colors: All Apogee connectors have six
pins, but not all pins are used for every sensor. There
may also be unused wire colors inside the cable. To
simplify datalogger connection, we remove the unused
pigtail lead colors at the datalogger end of the cable.
If a replacement cable is required, please contact
Apogee directly to ensure ordering the proper pigtail
configuration.
Alignment: When reconnecting a sensor, arrows on the
connector jacket and an aligning notch ensure proper
orientation.
Disconnection for extended periods: When
disconnecting the sensor for an extended period of time
from a station, protect the remaining half of the
connector still on the station from water and dirt with
electrical tape or other method.
A reference notch inside the connector ensures
proper alignment before tightening.
When sending sensors in for calibration, only send the
sensor head.
Tightening: Connectors are designed to be firmly
finger-tightened only. There is an o-ring inside the
connector that can be overly compressed if a wrench is
used. Pay attention to thread alignment to avoid cross-
threading. When fully tightened, 1-2 threads may still
be visible.
WARNING: Do not tighten the connector by twisting
the black cable or sensor head, only twist the metal
connector (yellow arrows).
Finger-tighten firmly

OPERATION AND MEASUREMENT
Connect the sensor to a measurement device (meter, datalogger, controller) capable of measuring and displaying
or recording a millivolt signal (an input measurement range of approximately 0-2.5 V (SQ-512) or 0-5 V (SQ-515) is
required to cover the entire range of PPFD from the sun). In order to maximize the measurement resolution and
signal-to-noise ratio, the signal input range of the measurement device should closely match the output range of
the quantum sensors. The amplification circuit requires a power supply of 5.5 to 24 V DC. NOTE: To prevent sensor
damage, DO NOT connect the sensor to a power source greater than 24 VDC.
VERY IMPORTANT: Apogee changed all wiring colors of our bare-lead sensors in March 2018 in conjunction
with the release of inline cable connectors on some sensors. To ensure proper connection to your data device,
please note your serial number or if your sensor has a stainless-steel connector 30 cm from the sensor head then
use the appropriate wiring configuration below.
Wiring for SQ-512 & SQ-515 Serial Numbers 1690 and above or with a cable connector
Wiring for SQ-512 & SQ-515 Serial Numbers within Range 0-1689
White: Output
Red: Power
Black: Ground
White: Positive (signal from sensor)
Red: Input Power SQ-512 5-24 V DC,
SQ-515 5.5-24 V DC
Black: Ground (from sensor signal and output power)
Clear: Shield/Ground

Sensor Calibration
Apogee amplified full-spectrum quantum sensors, models SQ-212 and SQ-215, have a standard PPFD calibration
factor of exactly:
SQ-512: 1.6 µmol m-2 s-1 per mV
SQ-515: 0.8 µmol m-2 s-1 per mV
Multiply this calibration factor by the measured voltage to convert sensor output to PPFD in units of µmol m-2 s-1:
Calibration Factor (0.8 µmol m-2 s-1 per mV) * Sensor Output Signal (mV) = PPFD (µmol m-2 s-1)
0.8 * 2500 = 2000
Example of PPFD measurement with an Apogee quantum
sensor. Full sunlight yields a PPFD on a horizontal plane at
the Earth’s surface of approximately 2000 µmol m-2 s-1. This
yields an output signal of 2500 mV for the 0-5 V option or
an output signal of 1250 mV for the 0-2.5 V option. The
signal is converted to PPFD by multiplying by the
calibration factor.
Full Sunlight
(2000 µmol m-2s-1)
SQ-512
SQ-515
Sensor Output: 1250 mV
Conversion Factor: 1.6 µmol m-2 s-1 per mV
Sensor Output: 2500 mV
Conversion Factor: 0.8 µmol m-2 s-1 per mV

Spectral Error
The combination of diffuser transmittance, interference filter transmittance, and photodetector sensitivity yields
spectral response of a quantum sensor. A perfect photodetector/filter/diffuser combination would exactly match
the defined plant photosynthetic response to photons (equal weighting to all photons between 400 and 700 nm,
no weighting of photons outside this range), but this is challenging in practice. Mismatch between the defined
plant photosynthetic response and sensor spectral response results in spectral error when the sensor is used to
measure radiation from sources with a different spectrum than the radiation source used to calibrate the sensor
(Federer and Tanner, 1966; Ross and Sulev, 2000).
Spectral errors for PPFD measurements made under common radiation sources for growing plants were calculated
for Apogee SQ-100 and SQ-500 series quantum sensors using the method of Federer and Tanner (1966). This
method requires PPFD weighting factors (defined plant photosynthetic response), measured sensor spectral
response (shown in Spectral Response section on page 7), and radiation source spectral outputs (measured with a
spectroradiometer). Note, this method calculates spectral error only and does not consider calibration, directional
(cosine), temperature, and stability/drift errors. Spectral error data (listed in table below) indicate errors less than
5 % for sunlight in different conditions (clear, cloudy, reflected from plant canopies, transmitted below plant
canopies) and common broad spectrum electric lamps (cool white fluorescent, metal halide, high pressure
sodium), but larger errors for different mixtures of light emitting diodes (LEDs) for the SQ-100 series sensors.
Spectral errors for the SQ-500 series sensors are smaller than those for SQ-100 series sensors because the spectral
response of SQ-500 series sensors is a closer match to the defined plant photosynthetic response.
Quantum sensors are the most common instrument for measuring PPFD, because they are about an order of
magnitude lower cost the spectroradiometers, but spectral errors must be considered. The spectral errors in the
table below can be used as correction factors for individual radiation sources.
Spectral Errors for PPFD Measurements with Apogee SQ-100 and SQ-500 Series Quantum Sensors
Radiation Source (Error Calculated Relative to Sun, Clear Sky)
SQ-100 Series
PPFD Error [%]
SQ-500 Series
PPFD Error [%]
Sun (Clear Sky)
0.0
0.0
Sun (Cloudy Sky)
0.2
0.1
Reflected from Grass Canopy
3.8
-0.3
Transmitted below Wheat Canopy
4.5
0.1
Cool White Fluorescent (T5)
0.0
0.1
Metal Halide
-2.8
0.9
Ceramic Metal Halide
-16.1
0.3
High Pressure Sodium
0.2
0.1
Blue LED (448 nm peak, 20 nm full-width half-maximum)
-10.5
-0.7
Green LED (524 nm peak, 30 nm full-width half-maximum)
8.8
3.2
Red LED (635 nm peak, 20 nm full-width half-maximum)
2.6
0.8
Red LED (667 nm peak, 20 nm full-width half-maximum)
-62.1
2.8
Red, Blue LED Mixture (80 % Red, 20 % Blue)
-72.8
-3.9
Red, Blue, White LED Mixture (60 % Red, 25 % White, 15 % Blue)
-35.5
-2.0
Cool White LED
-3.3
0.5
Warm White LED
-8.9
0.2
Federer, C.A., and C.B. Tanner, 1966. Sensors for measuring light available for photosynthesis. Ecology 47:654-657.
Ross, J., and M. Sulev, 2000. Sources of errors in measurements of PAR. Agricultural and Forest Meteorology
100:103-125.

Yield Photon Flux Density (YPFD) Measurements
Photosynthesis in plants does not respond equally to all photons. Relative quantum yield (plant photosynthetic
efficiency) is dependent on wavelength (green line in figure below) (McCree, 1972a; Inada, 1976). This is due to the
combination of spectral absorptivity of plant leaves (absorptivity is higher for blue and red photons than green
photons) and absorption by non-photosynthetic pigments. As a result, photons in the wavelength range of
approximately 600-630 nm are the most efficient.
One potential definition of PAR is weighting photon flux density in units of mol m-2 s-1 at each wavelength
between 300 and 800 nm by measured relative quantum yield and summing the result. This is defined as yield
photon flux density (YPFD, units of mol m-2 s-1) (Sager et al., 1988). There are uncertainties and challenges
associated with this definition of PAR. Measurements used to generate the relative quantum yield data were made
on single leaves under low radiation levels and at short time scales (McCree, 1972a; Inada, 1976). Whole plants
and plant canopies typically have multiple leaf layers and are generally grown in the field or greenhouse over the
course of an entire growing season. Thus, actual conditions plants are subject to are likely different than those the
single leaves were in when measurements were made by McCree (1972a) and Inada (1976). In addition, relative
quantum yield shown in the figure above is the mean from twenty-two species grown in the field (McCree, 1972a).
Mean relative quantum yield for the same species grown in growth chambers was similar, but there were
differences, particularly at shorter wavelengths (less than 450 nm). There was also some variability between
species (McCree, 1972a; Inada, 1976).
McCree (1972b) found that equally weighting all photons between 400 and 700 nm and summing the result,
defined as photosynthetic photon flux density (PPFD, in units of mol m-2 s-1), was well correlated to
photosynthesis, and very similar to correlation between YPFD and photosynthesis. As a matter of practicality, PPFD
is a simpler definition of PAR. At the same time as McCree’s work, others had proposed PPFD as an accurate
measure of PAR and built sensors that approximated the PPFD weighting factors (Biggs et al., 1971; Federer and
Tanner, 1966). Correlation between PPFD and YPFD measurements for several radiation sources is very high (figure
below), as an approxismation, YPFD = 0.9PPFD. As a result, almost universally PAR is defined as PPFD rather than
YPFD, although YPFD has been used in some studies. The only radiation sources shown (figure below) that don’t
fall on the regression line are the high-pressure sodium (HPS) lamp, reflection from a plant canopy, and
transmission below a plant canopy. A large fraction of radiation from HPS lamps is in the red range of wavelengths
where the YPFD weighting factors (measured relative quantum yield) are at or near one. The factor for converting
PPFD to YPFD for HPS lamps is 0.95, rather than 0.90. The factor for converting PPFD to YPFD for reflected and
transmitted photons is 1.00.
Defined plant response to
photons (black line, weighting
factors used to calculate PPFD),
measured plant response to
photons (green line, weighting
factors used to calculate YPFD),
and SQ-500 series quantum
sensor response to photons
(sensor spectral response).

Underwater Measurements and Immersion Effect
When a quantum sensor that was calibrated in air is used to make underwater measurements, the sensor reads
Correlation between
photosynthetic photon flux
density (PPFD) and yield photon
flux density (YPFD) for multiple
different radiation sources. YPFD
is approximately 90 % of PPFD.
Measurements were made with
a spectroradiometer (Apogee
Instruments model PS-200) and
weighting factors shown in the
previous figure were used to
calculate PPFD and YPFD.
Biggs, W., A.R. Edison, J.D. Eastin, K.W. Brown, J.W. Maranville, and M.D. Clegg, 1971. Photosynthesis light sensor
and meter. Ecology 52:125-131.
Federer, C.A., and C.B. Tanner, 1966. Sensors for measuring light available for photosynthesis. Ecology 47:654-657.
Inada, K., 1976. Action spectra for photosynthesis in higher plants. Plant and Cell Physiology 17:355-365.
McCree, K.J., 1972a. The action spectrum, absorptance and quantum yield of photosynthesis in crop plants.
Agricultural Meteorology 9:191-216.
McCree, K.J., 1972b. Test of current definitions of photosynthetically active radiation against leaf photosynthesis
data. Agricultural Meteorology 10:443-453.
Sager, J.C., W.O. Smith, J.L. Edwards, and K.L. Cyr, 1988. Photosynthetic efficiency and phytochrome
photoequilibria determination using spectral data. Transactions of the ASAE 31:1882-1889.

Immersion Effect Correction Factor
When a radiation sensor is submerged in water, more of the incident radiation is backscattered out of the diffuser
than when the sensor is in air (Smith, 1969; Tyler and Smith, 1970). This phenomenon is caused by the difference
in the refractive index for air (1.00) and water (1.33) and is called the immersion effect. Without correction for the
immersion effect, radiation sensors calibrated in air can only provide relative values underwater (Smith, 1969;
Tyler and Smith, 1970). Immersion effect correction factors can be derived by making measurements in air and at
multiple water depths at a constant distance from a lamp in a controlled laboratory setting.
Apogee SQ-500 series quantum sensors have an immersion effect correction factor of 1.25 (SQ-512 serial # 3656
and above; SQ-515 serial # 3857 and above) or 1.32 (SQ-512 serial # 0-3655; SQ-515 serial # 0-3856). This
correction factor should be multiplied by PPFD measurements made underwater to yield accurate PPFD.
Further information on underwater measurements and the immersion effect can be found on the Apogee
webpage (http://www.apogeeinstruments.com/underwater-par-measurements/).
Smith, R.C., 1969. An underwater spectral irradiance collector. Journal of Marine Research 27:341-351.
Tyler, J.E., and R.C. Smith, 1970. Measurements of Spectral Irradiance Underwater. Gordon and Breach, New York,
New York. 103 pages

MAINTENANCE AND RECALIBRATION
Blocking of the optical path between the target and detector can cause low readings. Occasionally, accumulated
materials on the diffuser of the upward-looking sensor can block the optical path in three common ways:
1. Moisture or debris on the diffuser.
2. Dust during periods of low rainfall.
3. Salt deposit accumulation from evaporation of sea spray or sprinkler irrigation water.
Apogee Instruments upward-looking sensors have a domed diffuser and housing for improved self-cleaning from
rainfall, but active cleaning may be necessary. Dust or organic deposits are best removed using water, or window
cleaner, and a soft cloth or cotton swab. Salt deposits should be dissolved with vinegar and removed with a cloth
or cotton swab. Salt deposits cannot be removed with solvents such as alcohol or acetone. Use only gentle
pressure when cleaning the diffuser with a cotton swab or soft cloth to avoid scratching the outer surface. The
solvent should be allowed to do the cleaning, not mechanical force. Never use abrasive material or cleaner on the
diffuser.
Although Apogee sensors are very stable, nominal accuracy drift is normal for all research-grade sensors. To
ensure maximum accuracy, we generally recommend sensors are sent in for recalibration every two years,
although you can often wait longer according to your particular tolerances.
To determine if a specific sensor needs recalibration, the Clear Sky Calculator (www.clearskycalculator.com)
website and/or smartphone app can be used to indicate PPFD incident on a horizontal surface at any time of day at
any location in the world. It is most accurate when used near solar noon in spring and summer months, where
accuracy over multiple clear and unpolluted days is estimated to be ± 4 % in all climates and locations around the
world. For best accuracy, the sky must be completely clear, as reflected radiation from clouds causes incoming
radiation to increase above the value predicted by the clear sky calculator. Measured PPFD can exceed PPFD
predicted by the Clear Sky Calculator due to reflection from thin, high clouds and edges of clouds, which enhances
incident PPFD. The influence of high clouds typically shows up as spikes above clear sky values, not a constant
offset greater than clear sky values.
To determine recalibration need, input site conditions into the calculator and compare PPFD measurements to
calculated PPFD for a clear sky. If sensor PPFD measurements over multiple days near solar noon are consistently
different than calculated PPFD (by more than 6 %), the sensor should be cleaned and re-leveled. If measurements
are still different after a second test, email calibration@apogeeinstruments.com to discuss test results and
possible return of sensor(s).

Homepage of the Clear Sky
Calculator. Two calculators are
available: one for quantum
sensors (PPFD) and one for
pyranometers (total shortwave
radiation).
Clear Sky Calculator for
quantum sensors. Site data are
input in blue cells in middle of
page and an estimate of PPFD is
returned on right-hand side of
page.

TROUBLESHOOTING AND CUSTOMER SUPPORT
Independent Verification of Functionality
Apogee SQ-512 and SQ-515 quantum sensors provide an amplified voltage output that is proportional to incident
PPFD. A quick and easy check of sensor functionality can be determined using a DC power supply and a voltmeter.
Power the sensor with a DC voltage by connecting the positive voltage signal to the red wire from the sensor and
the negative (or common) to the black wire from the sensor. Use the voltmeter to measure across the white wire
(output signal) and black wire. Direct the sensor head toward a light source and verify the sensor provides a signal.
Increase and decrease the distance from the sensor head to the light source to verify that the signal changes
proportionally (decreasing signal with increasing distance and increasing signal with decreasing distance). Blocking
all radiation from the sensor should force the sensor signal to zero.
Compatible Measurement Devices (Dataloggers/Controllers/Meters)
SQ-500 series quantum sensors are calibrated with a standard calibration factor of 1.6 µmol m-2 s-1 per mV (SQ-
512) or 0.8 µmol m-2 s-1 per mV (SQ-515), yielding a sensitivity of 0.6 mV per µmol m-2 s-1 (SQ-512) or 1.3 mV per
µmol m-2 s-1 (SQ-515). Thus, a compatible measurement device (e.g., datalogger or controller) should have
resolution of at least 0.6 mV (SQ-512) or 1.3 mV (SQ-515) in order to provide PPFD resolution of 1 µmol m-2 s-1.
An example datalogger program for Campbell Scientific dataloggers can be found on the Apogee webpage at
http://www.apogeeinstruments.com/downloads/.
Zero Offset Error
With the use of certain dataloggers it is possible for to measure a non-zero voltage (zero offset) when the sensor
output should be zero (no photons incident on diffuser). This offset can be corrected by applying the necessary
correction offset in the datalogger program. To test if a zero offset exists, connect the sensor to the datalogger in
question, cover the sensor head completely with a thick black cloth to block all photons, and allow the reading to
stabilize. If an offset exists, connect the sensor lead wires to a DC power supply and an independent measurement
instrument, such as a voltmeter, cover the sensor head completely to block all photons, and allow the reading to
stabilize. If the offset still exists, contact Apogee customer support to recalibrate the sensor. If the offset does not
exist, program the datalogger to take into account the offset attributed by the datalogger in question.
Cable Length
When the sensor is connected to a measurement device with high input impedance, sensor output signals are not
changed by shortening the cable or splicing on additional cable in the field. Tests have shown that if the input
impedance of the measurements device is greater than 1 mega-ohm there is negligible effect on the calibration,
even after adding up to 100 m of cable. All Apogee sensors use shielded, twisted pair cable to minimize
electromagnetic interference. For best measurements, the shield wire must be connected to an earth ground. This
is particularly important when using the sensor with long lead lengths in electromagnetically noisy environments.
Modifying Cable Length
See Apogee webpage for details on how to extend sensor cable length:
(http://www.apogeeinstruments.com/how-to-make-a-weatherproof-cable-splice/).
/