Page is loading ...

MODEL L-656
RD/FL TEST TOOL
January 2011


MODEL L-656
RD/FL TEST TOOL
January 2011


Model L-656 RD/FL Test Tool
Ludlum Medical Physics January 2011
Table of Contents
Overview 1
General Procedure 2
Radiographic Systems 3
Fluoroscopic Systems 4
Results 5

Model L-656 RD/FL Test Tool
Ludlum Medical Physics Page 1 January 2011
Overview
he RD/FL Test Tool was designed to give the
diagnostic medical physicist, radiologic technologist,
and/or service engineer an easy method for a quick
evaluation of the image quality and performance of the
departmental diagnostic radiographic and fluoroscopic imaging
systems.
The RD/FL Test Tool provides and easy-to-use method for a
quick overview of the constancy of the imaging system. For a
standard R/F system, no more than 5-10 minutes should be
required to complete the suggested protocol.
It is generally recommended that the test tool be utilized on all
of the departmental radiographic and fluoroscopic equipment
on at least a monthly basis.
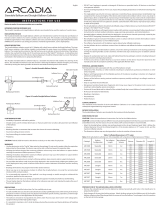
At the center of the test tool is a line pair resolution pattern
and a short contrast scale that allows simultaneous evaluation
of the general resolution, contrast, and density uniformity of
the imaging chain.
T

Model L-656 RD/FL Test Tool
Ludlum Medical Physics Page 2 January 2011
General Procedure
It is preferred that an imaging (chain) evaluation be performed
at least monthly. More frequent evaluations are suggested to
prevent any unexpected imaging problems before actual clinical
procedures are performed with the equipment. For more
sensitive procedures, like C-arm studies in the OR,
consideration should be given to utilizing the test tool before
each use of the equipment.

Model L-656 RD/FL Test Tool
Ludlum Medical Physics Page 3 January 2011
Radiographic Systems
1. When utilizing the automatic exposure control mode, the
techniques typical for a small abdomen usually work best to
properly image the test tool (e.g., 70 kVp, center cell).
Manual techniques may also be used.
2. It is critical that the test tool be positioned the same for
every exposure and for each (daily or monthly) evaluation.
Specific location on the table or imaging surface should be
noted for future reference.
3. Visually inspect the image on a standard view box and
determine the smallest mesh pattern that is clearly visible.
This value should also be recorded on the film. Also make
note of the smallest pair that is clearly visible within the
line pair resolution pattern. (It is useful to circle these areas
on the film with a wax pencil or marker.
4. Measure the density of the four contrast squares and plot
these values on a graph. Subtract the density of the #4
block from the #2 block and note this “contrast index
value” on the graph as well.
5. Place the film in the appropriate QA file.

Model L-656 RD/FL Test Tool
Ludlum Measurements, Inc. page 4 January 2011
Fluoroscopic Systems
1. Place the test tool on the table.
2. Position the image intensifier tower approximately 30.5 cm
(12 in.) above the table. The same image intensifier height
should be used for every evaluation.
3. During fluoroscopy, while utilizing radiation safety
methods (lead gloves, apron), center the test tool under the
image intensifier. For proper visualization of the various
targets, 70 kVp is recommended for the fluoro kV.
4. Evaluate the fluoroscopic image and determine the smallest
mesh pattern that is clearly visible. Also make note of the
smallest line pair that is clearly visible within the line pair
resolution pattern. (It is useful to circle these areas on the
film with a wax pencil or marker.)
5. Make a spot film image of the test tool. Process the film
then visually inspect the image on a standard view box and
determine the smallest mesh pattern and low-contrast
target that is clearly visible. Also make note of the smallest
line pair that is clearly visible within the line pair resolution
pattern. Measure the density of the four contrast squares
and plot these values on a graph. Subtract the density of
the #4 block from the #2 block and note this “contrast
index value” on the graph as well. Also make note of the
kV and mAs utilized to create the film. If the image is
acceptable, this should become the standard to measure
future films against.

Model L-656 RD/FL Test Tool
Ludlum Measurements, Inc. page 5 January 2011
Results
Again, the results of the evaluation may be plotted on a graph
rather than just recorded on the film or log sheet. Graphed
results will make it easier to detect any trends that could
adversely affect the performance of the system.
A properly functioning fluoroscopy system should be able to
resolve at least the 20 mesh at the center of the image in the
smallest mode. From image to image, the smallest mesh
available should not decrease by more than one step. Changes
in resolution on a film should be 2.8 lp/mm in 15.2 cm (6 in.)
mode; and 2.5 lp/mm in 22.9 cm (9 in.) mode. The resolution
should not decrease from a five-day average value by more
than the smallest visible pair on the pattern.
The mAs for radiographic systems and the kVp and mA for
fluoro systems should remain constant to within 10%. No
increasing trends should be observed. However, it is possible
to observe trends that do not move consistently in the same
direction, but instead move either upward or downward over a
longer period of time. In either case, any inconsistencies should
be noted, and corrective action should be scheduled.
/